|
|
| Help | |
| You are here: Rediff Home » India » Cricket » The Cup » Statistics |
|
Last Updated: March 13, 2007 16:34 IST
In just a few hours from now, the World Cup will kick off with hosts West Indies taking on Pakistan. And when the team batting second walks out to begin the chase, we will get to test our Pressure Index, for the first time, in the context of a live game.
While waiting for that, we tried using the PI formula to analyze one more game - the 2nd ODI between India and Sri Lanka, played at Rajkot on 11 February 2007.
It was a curious match, which India seemed to be winning comfortably almost till the very end. But things went horribly wrong at the end.
Sri Lanka scored 257 in 50 overs, largely because of a superb century by Sangakkara and a good supporting innings by Dilshan.
As Uthappa and Ganguly opened the innings, India looked the more likely team to win. A target of 275 might have offered a more even challenge.
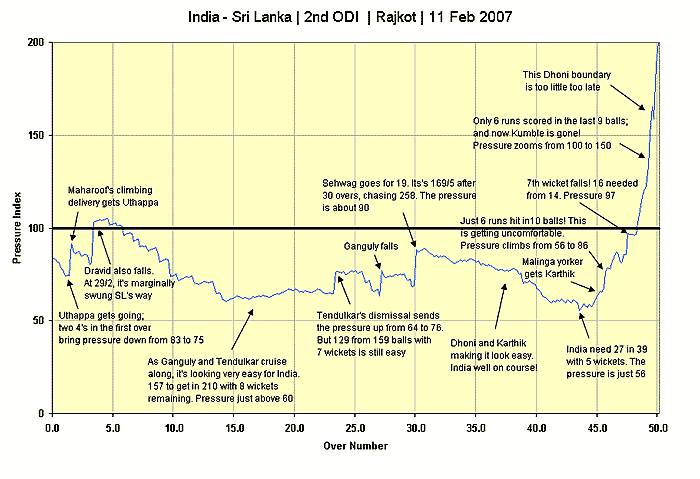
There was a moment of concern as Uthappa and Dravid fell in quick succession, and the pressure index briefly edged past 100. But two good partnerships, between Ganguly-Tendulkar and Dhoni-Karthik ensured that India's pressure stayed well below 100.
Even when Karthik fell to a Malinga yorker, India seemed comfortably on course, with the pressure rising only from 68 to 76.
But some very tight Sri Lankan bowling, and falling wickets, sent the pressure zooming upwards. The match slipped inexplicably out of India's grasp.
The graph plots the Indian innings against the PI, showing you the various stages in the game and how pressure climbed suddenly, almost inexplicably, to take India out of the game.

The core idea of the pressure index (PI) is rather simple.
Imagine that India need to score 275 in 50 overs to win.
India's ability to score these runs depends on how well their batsmen can counter the opposing bowlers in the prevailing match conditions. So a wide variety of factors such as quality of batsmen, quality of bowling attack, nature of pitch, day-night match, long or short boundaries, recent form etc. will have to be considered.
Since it is hard (and perhaps silly) to quantify all these variables, we simply ask an expert (or three experts) what's India's likely score will be if they bat 50 overs in these conditions.
Suppose the experts say that India can only get 250. Since 250 is less than 275, this means that India start with a less than even chance of winning. India's pressure as they go in to bat is therefore more than 100.
A few lusty blows by Sehwag can, however, quickly change things. It all hinges on the ratio between the number of runs needed to win and the number of runs that India can potentially score. This potential score depends on the resources available; i.e. the number of overs remaining and the number of wickets lost.
If Sehwag hits four boundaries in the first over, the numerator in the ratio reduces quite a bit but the denominator hardly changes, because very little of the available resource is used up. This results in a reduced pressure index.
If, however, Sehwag gets out in the very next over, then the boot is on the other foot. The numerator stays much the same, but the denominator becomes smaller because of the lost wicket resource. The pressure index again swings upwards.
To calculate the pressure index, we wrap a symmetric function around this ratio in such a way that the PI always lies between 0 and 200, with 100 as the "fifty-fifty" point. This also gives us the useful property that if India's pressure index, while chasing a Sri Lankan target, is 125, then Sri Lanka's corresponding pressure index will be 75.
We also use coefficients to "perk up" the PI value so that it is more responsive to the on-field action; after all, it would be pretty dull if the PI always hovers between 90 and 110 most of the time.
As the match proceeds, we progressively reduce the "weight" of the expert's estimate. This makes sense. In the early overs, when the match is still uncertain, the expert's view counts for more; but, once the match settles down, the picture becomes clearer to everyone and an expert is quite unnecessary.
We use our own resource tables for the calculations; but these tables are not dissimilar to the tables used by the Jayadevan and D/L methods. So, in most cases, expect the chasing team to lose the match by the D/L method if its pressure index is over 100 when the match is aborted.
The Cup: Complete Coverage
Would you like to join the Cricket and Cricket Lovers Discussion Group and discuss your cricket views with other cricket freaks? Click here. Have fun!
|
|
| © 2007 Rediff.com India Limited. All Rights Reserved. Disclaimer | Feedback |